


signal strength 1 of 5
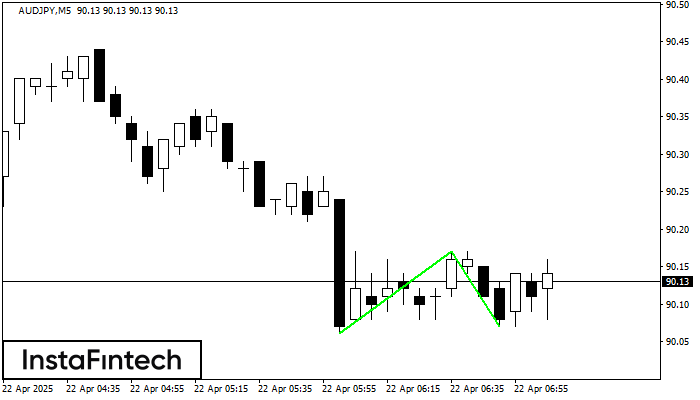
The Double Bottom pattern has been formed on AUDJPY M5. This formation signals a reversal of the trend from downwards to upwards. The signal is that a buy trade should be opened after the upper boundary of the pattern 90.17 is broken. The further movements will rely on the width of the current pattern 11 points.
The M5 and M15 time frames may have more false entry points.
আরও দেখুন
- All
- Double Top
- Flag
- Head and Shoulders
- Pennant
- Rectangle
- Triangle
- Triple top
- All
- #AAPL
- #AMZN
- #Bitcoin
- #EBAY
- #FB
- #GOOG
- #INTC
- #KO
- #MA
- #MCD
- #MSFT
- #NTDOY
- #PEP
- #TSLA
- #TWTR
- AUDCAD
- AUDCHF
- AUDJPY
- AUDUSD
- EURCAD
- EURCHF
- EURGBP
- EURJPY
- EURNZD
- EURRUB
- EURUSD
- GBPAUD
- GBPCHF
- GBPJPY
- GBPUSD
- GOLD
- NZDCAD
- NZDCHF
- NZDJPY
- NZDUSD
- SILVER
- USDCAD
- USDCHF
- USDJPY
- USDRUB
- All
- M5
- M15
- M30
- H1
- D1
- All
- Buy
- Sale
- All
- 1
- 2
- 3
- 4
- 5
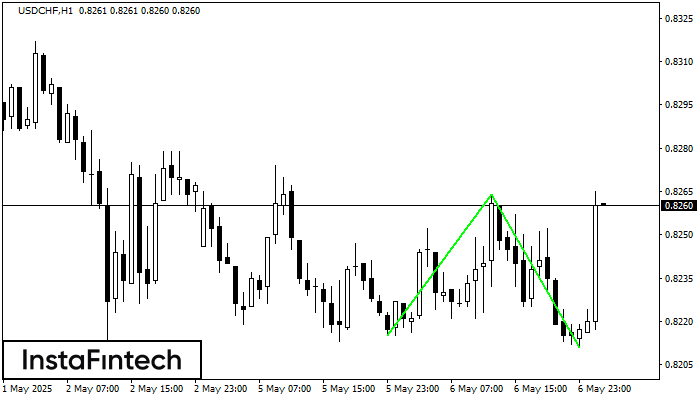
The Double Bottom pattern has been formed on USDCHF H1; the upper boundary is 0.8264; the lower boundary is 0.8211. The width of the pattern is 49 points. In case
Open chart in a new window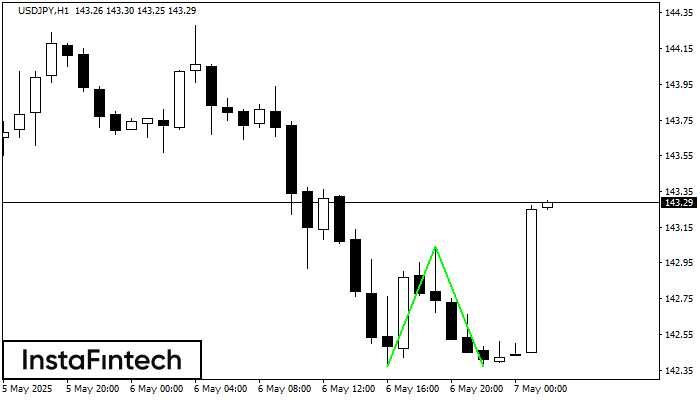
The Double Bottom pattern has been formed on USDJPY H1. Characteristics: the support level 142.37; the resistance level 143.04; the width of the pattern 67 points. If the resistance level
Open chart in a new window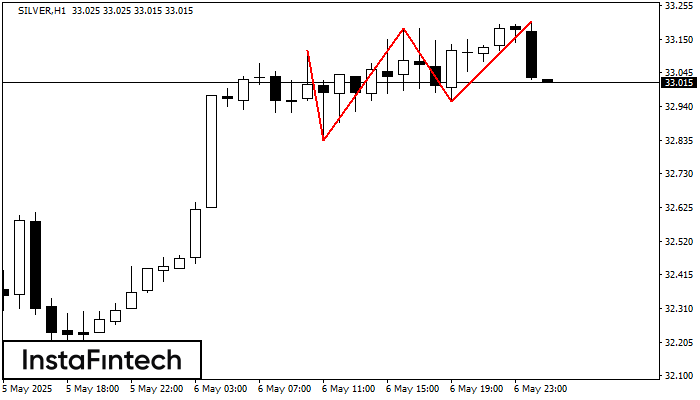
The Triple Top pattern has formed on the chart of the SILVER H1. Features of the pattern: borders have an ascending angle; the lower line of the pattern
Open chart in a new window


