


signal strength 3 of 5

The technical pattern called Head and Shoulders has appeared on the chart of EURGBP M30. There are weighty reasons to suggest that the price will surpass the Neckline 0.8358/0.8357 after the right shoulder has been formed. So, the trend is set to change with the price heading for 0.8327.
- All
- Double Top
- Flag
- Head and Shoulders
- Pennant
- Rectangle
- Triangle
- Triple top
- All
- #AAPL
- #AMZN
- #Bitcoin
- #EBAY
- #FB
- #GOOG
- #INTC
- #KO
- #MA
- #MCD
- #MSFT
- #NTDOY
- #PEP
- #TSLA
- #TWTR
- AUDCAD
- AUDCHF
- AUDJPY
- AUDUSD
- EURCAD
- EURCHF
- EURGBP
- EURJPY
- EURNZD
- EURRUB
- EURUSD
- GBPAUD
- GBPCHF
- GBPJPY
- GBPUSD
- GOLD
- NZDCAD
- NZDCHF
- NZDJPY
- NZDUSD
- SILVER
- USDCAD
- USDCHF
- USDJPY
- USDRUB
- All
- M5
- M15
- M30
- H1
- D1
- All
- Buy
- Sale
- All
- 1
- 2
- 3
- 4
- 5
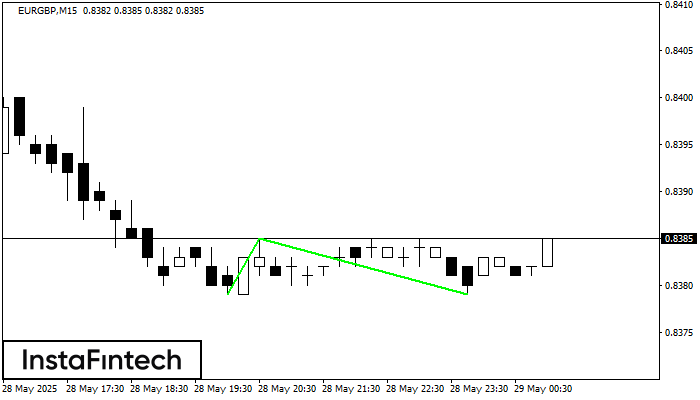
The Double Bottom pattern has been formed on EURGBP M15. This formation signals a reversal of the trend from downwards to upwards. The signal is that a buy trade should
The M5 and M15 time frames may have more false entry points.
Open chart in a new window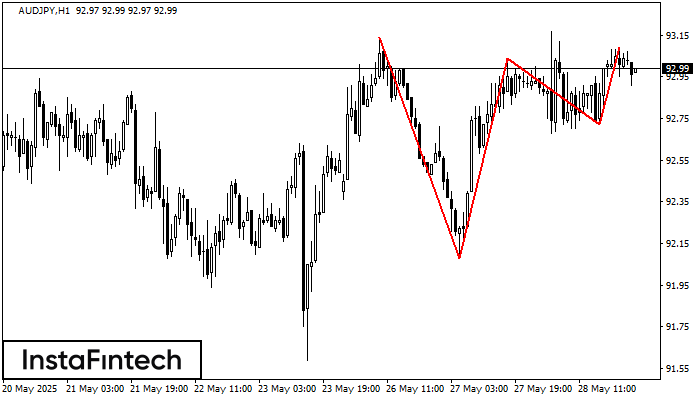
The Triple Top pattern has formed on the chart of the AUDJPY H1 trading instrument. It is a reversal pattern featuring the following characteristics: resistance level 5, support level -64
Open chart in a new window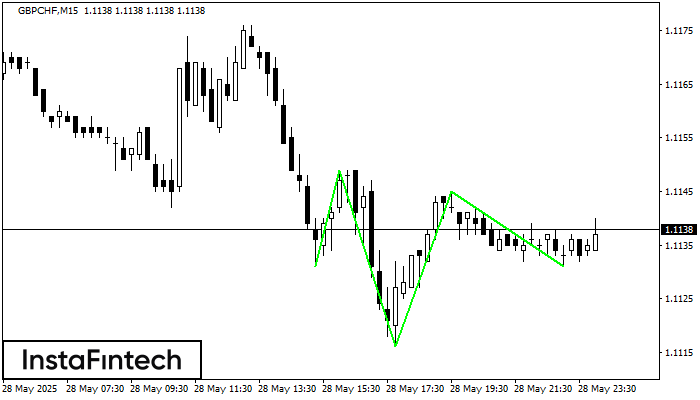
According to the chart of M15, GBPCHF produced the pattern termed the Inverse Head and Shoulder. The Head is fixed at 1.1116 while the median line of the Neck
The M5 and M15 time frames may have more false entry points.
Open chart in a new window


