


signal strength 1 of 5
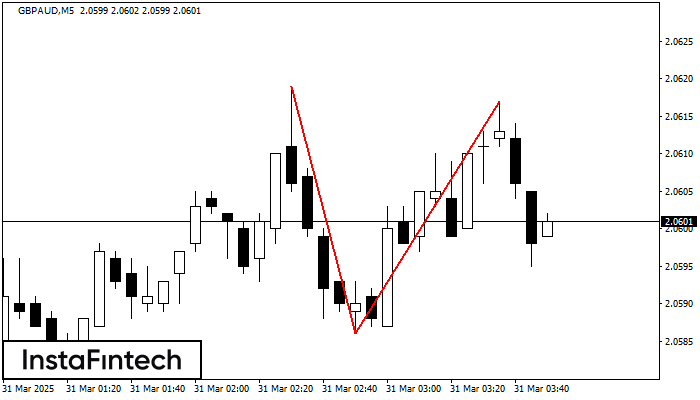
On the chart of GBPAUD M5 the Double Top reversal pattern has been formed. Characteristics: the upper boundary 2.0617; the lower boundary 2.0586; the width of the pattern 31 points. The signal: a break of the lower boundary will cause continuation of the downward trend targeting the 2.0571 level.
The M5 and M15 time frames may have more false entry points.
আরও দেখুন
- All
- Double Top
- Flag
- Head and Shoulders
- Pennant
- Rectangle
- Triangle
- Triple top
- All
- #AAPL
- #AMZN
- #Bitcoin
- #EBAY
- #FB
- #GOOG
- #INTC
- #KO
- #MA
- #MCD
- #MSFT
- #NTDOY
- #PEP
- #TSLA
- #TWTR
- AUDCAD
- AUDCHF
- AUDJPY
- AUDUSD
- EURCAD
- EURCHF
- EURGBP
- EURJPY
- EURNZD
- EURRUB
- EURUSD
- GBPAUD
- GBPCHF
- GBPJPY
- GBPUSD
- GOLD
- NZDCAD
- NZDCHF
- NZDJPY
- NZDUSD
- SILVER
- USDCAD
- USDCHF
- USDJPY
- USDRUB
- All
- M5
- M15
- M30
- H1
- D1
- All
- Buy
- Sale
- All
- 1
- 2
- 3
- 4
- 5

The Triple Bottom pattern has formed on the chart of the USDJPY M30 trading instrument. The pattern signals a change in the trend from downwards to upwards in the case
Open chart in a new window
The Double Bottom pattern has been formed on AUDCHF H1; the upper boundary is 0.5198; the lower boundary is 0.5165. The width of the pattern is 34 points. In case
Open chart in a new window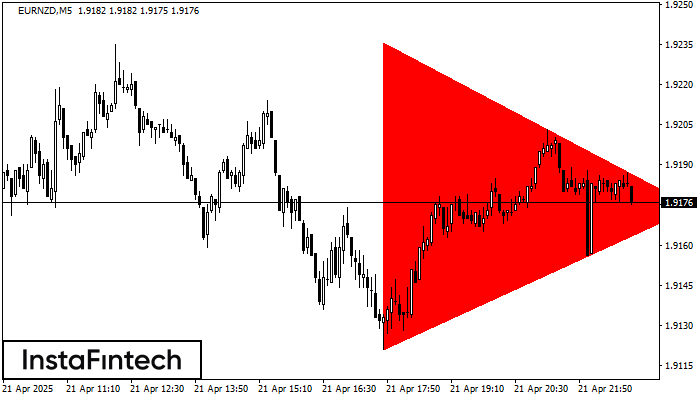
According to the chart of M5, EURNZD formed the Bearish Symmetrical Triangle pattern. Description: The lower border is 1.9121/1.9174 and upper border is 1.9236/1.9174. The pattern width is measured
The M5 and M15 time frames may have more false entry points.
Open chart in a new window
According to the chart of M15, #FB formed the Inverse Head and Shoulder pattern. The Head’s top is set at 485.03 while the median line of the Neck is found
The M5 and M15 time frames may have more false entry points.
Open chart in a new window
The Bearish pennant pattern has formed on the #FB H1 chart. This pattern type is characterized by a slight slowdown after which the price will move in the direction
Open chart in a new window
The Triple Bottom pattern has been formed on #AAPL M15. It has the following characteristics: resistance level 191.73/191.10; support level 189.80/190.18; the width is 193 points. In the event
The M5 and M15 time frames may have more false entry points.
Open chart in a new window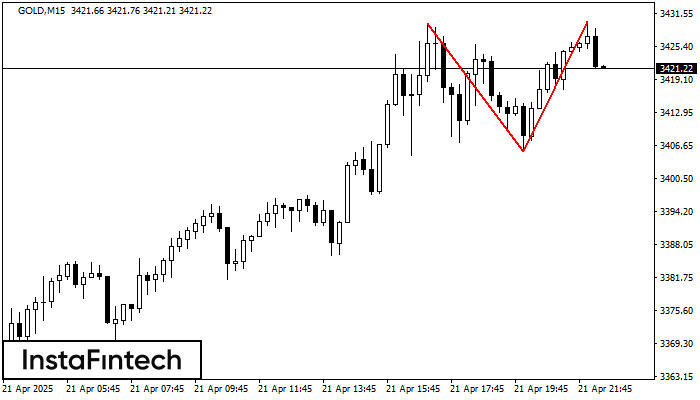
The Double Top reversal pattern has been formed on GOLD M15. Characteristics: the upper boundary 3429.80; the lower boundary 3405.54; the width of the pattern is 2449 points. Sell trades
The M5 and M15 time frames may have more false entry points.
Open chart in a new window
The Double Bottom pattern has been formed on #PEP M5. This formation signals a reversal of the trend from downwards to upwards. The signal is that a buy trade should
The M5 and M15 time frames may have more false entry points.
Open chart in a new window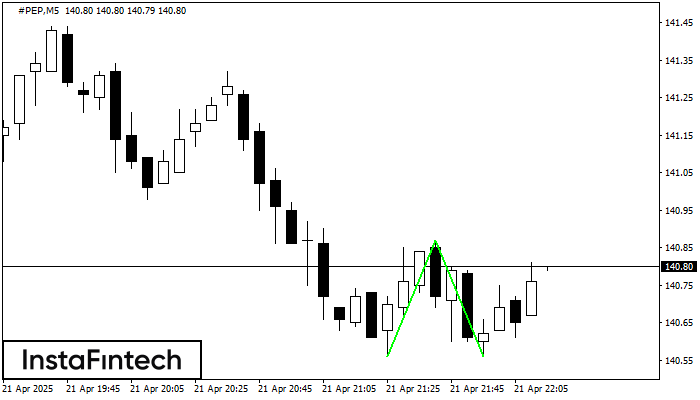
The Double Bottom pattern has been formed on #PEP M5. Characteristics: the support level 140.56; the resistance level 140.87; the width of the pattern 31 points. If the resistance level
The M5 and M15 time frames may have more false entry points.
Open chart in a new window


