


signal strength 3 of 5
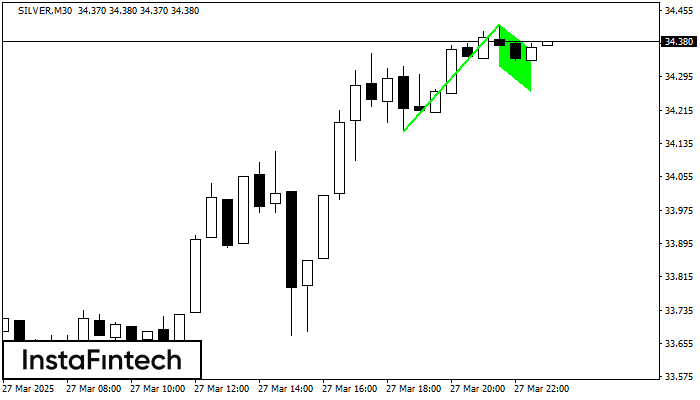
The Bullish Flag pattern has been formed on SILVER at M30. The lower boundary of the pattern is located at 34.32/34.26, while the higher boundary lies at 34.42/34.36. The projection of the flagpole is 255 points. This formation signals that the upward trend is most likely to continue. Therefore, if the level of 34.42 is broken, the price will move further upwards.
- All
- Double Top
- Flag
- Head and Shoulders
- Pennant
- Rectangle
- Triangle
- Triple top
- All
- #AAPL
- #AMZN
- #Bitcoin
- #EBAY
- #FB
- #GOOG
- #INTC
- #KO
- #MA
- #MCD
- #MSFT
- #NTDOY
- #PEP
- #TSLA
- #TWTR
- AUDCAD
- AUDCHF
- AUDJPY
- AUDUSD
- EURCAD
- EURCHF
- EURGBP
- EURJPY
- EURNZD
- EURRUB
- EURUSD
- GBPAUD
- GBPCHF
- GBPJPY
- GBPUSD
- GOLD
- NZDCAD
- NZDCHF
- NZDJPY
- NZDUSD
- SILVER
- USDCAD
- USDCHF
- USDJPY
- USDRUB
- All
- M5
- M15
- M30
- H1
- D1
- All
- Buy
- Sale
- All
- 1
- 2
- 3
- 4
- 5
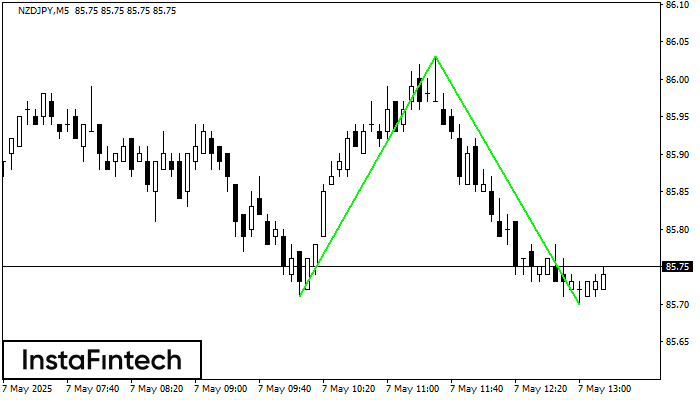
The Double Bottom pattern has been formed on NZDJPY M5. Characteristics: the support level 85.71; the resistance level 86.03; the width of the pattern 32 points. If the resistance level
The M5 and M15 time frames may have more false entry points.
Open chart in a new window
According to the chart of M15, USDCHF formed the Bearish Symmetrical Triangle pattern. This pattern signals a further downward trend in case the lower border 0.8211 is breached. Here
The M5 and M15 time frames may have more false entry points.
Open chart in a new window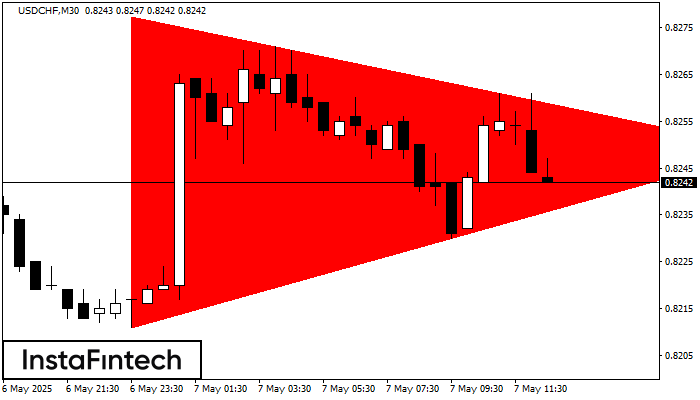
According to the chart of M30, USDCHF formed the Bearish Symmetrical Triangle pattern. This pattern signals a further downward trend in case the lower border 0.8211 is breached. Here
Open chart in a new window


