


signal strength 2 of 5
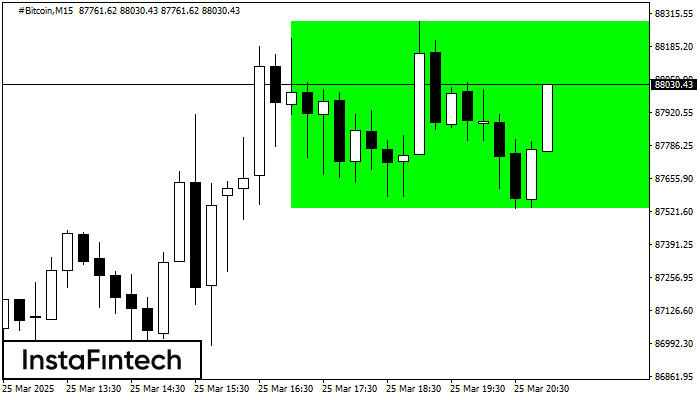
According to the chart of M15, #Bitcoin formed the Bullish Rectangle which is a pattern of a trend continuation. The pattern is contained within the following borders: the lower border 87534.22 – 87534.22 and upper border 88285.10 – 88285.10. In case the upper border is broken, the instrument is likely to follow the upward trend.
The M5 and M15 time frames may have more false entry points.
- All
- Double Top
- Flag
- Head and Shoulders
- Pennant
- Rectangle
- Triangle
- Triple top
- All
- #AAPL
- #AMZN
- #Bitcoin
- #EBAY
- #FB
- #GOOG
- #INTC
- #KO
- #MA
- #MCD
- #MSFT
- #NTDOY
- #PEP
- #TSLA
- #TWTR
- AUDCAD
- AUDCHF
- AUDJPY
- AUDUSD
- EURCAD
- EURCHF
- EURGBP
- EURJPY
- EURNZD
- EURRUB
- EURUSD
- GBPAUD
- GBPCHF
- GBPJPY
- GBPUSD
- GOLD
- NZDCAD
- NZDCHF
- NZDJPY
- NZDUSD
- SILVER
- USDCAD
- USDCHF
- USDJPY
- USDRUB
- All
- M5
- M15
- M30
- H1
- D1
- All
- Buy
- Sale
- All
- 1
- 2
- 3
- 4
- 5
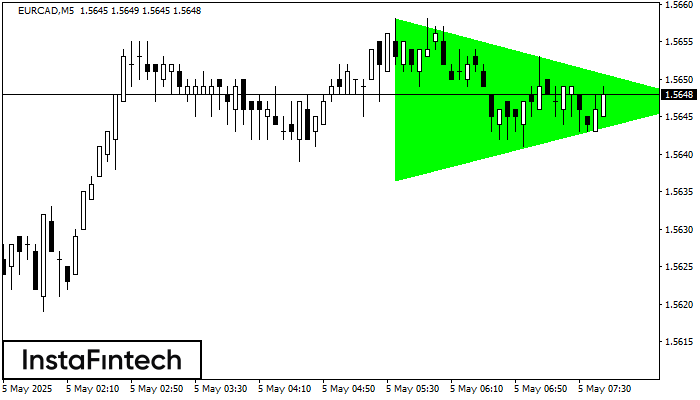
M5 চার্ট অনুযায়ী, EURCAD বুলিশ সিমেট্রিকাল ট্রায়াঙ্গেল প্যাটার্ন গঠন করেছে। প্যাটার্নের নীচের সীমানা 1.5636/1.5647-এর কোঅর্ডিনেটগুলো স্পর্শ করেছে যেখানে উপরের সীমানাটি 1.5658/1.5647 জুড়ে যাচ্ছে৷ যদি বুলিশ সিমেট্রিকাল ট্রায়াঙ্গেল প্যাটার্নটি বজায় থাকে
M5 এবং M15 টাইম ফ্রেমে আরও ভুল এন্ট্রি পয়েন্ট থাকতে পারে।
Open chart in a new window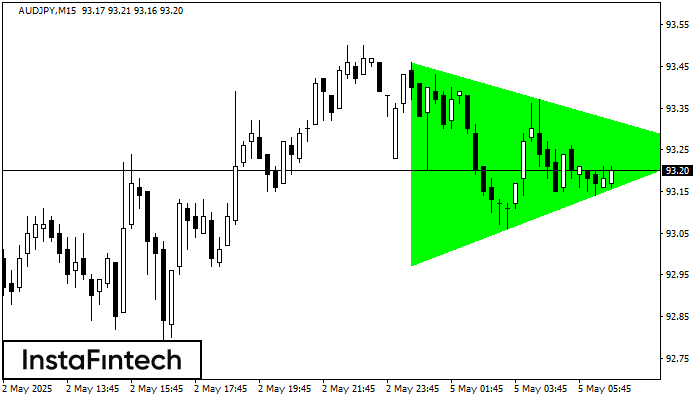
M15 চার্ট অনুযায়ী, AUDJPY বুলিশ সিমেট্রিকাল ট্রায়াঙ্গেল প্যাটার্ন গঠন করেছে। প্যাটার্নের নীচের সীমানা 92.97/93.25-এর কোঅর্ডিনেটগুলো স্পর্শ করেছে যেখানে উপরের সীমানাটি 93.46/93.25 জুড়ে যাচ্ছে৷ যদি বুলিশ সিমেট্রিকাল ট্রায়াঙ্গেল প্যাটার্নটি বজায় থাকে
M5 এবং M15 টাইম ফ্রেমে আরও ভুল এন্ট্রি পয়েন্ট থাকতে পারে।
Open chart in a new window
M5 চার্টে, NZDJPY-এর ডাবল টপ প্যাটার্নটি গঠিত হয়েছে। এটি এই ইঙ্গিত দেয় যে চলমান প্রবণতা ঊর্ধ্বমুখী থেকে নিম্নমুখীতে পরিবর্তিত হয়েছে। সম্ভবত, যদি 86.15 প্যাটার্নের ভিত্তিটি ব্রেক করা হয়, তাহলে নিম্নমুখী
M5 এবং M15 টাইম ফ্রেমে আরও ভুল এন্ট্রি পয়েন্ট থাকতে পারে।
Open chart in a new window


