

signal strength 3 of 5
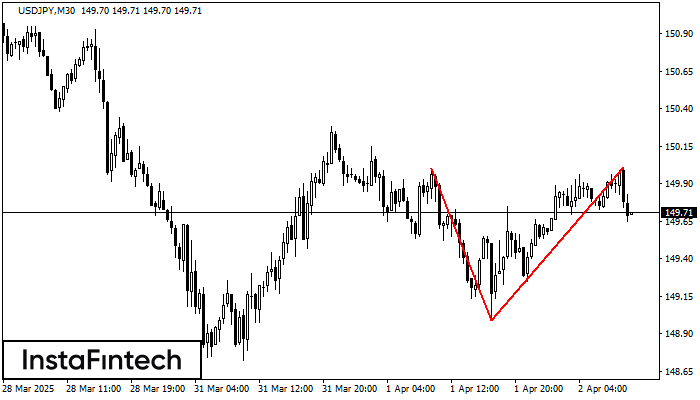
The Double Top reversal pattern has been formed on USDJPY M30. Characteristics: the upper boundary 150.00; the lower boundary 148.99; the width of the pattern is 102 points. Sell trades are better to be opened below the lower boundary 148.99 with a possible movements towards the 148.69 level.
انظر أيضا
- All
- Double Top
- Flag
- Head and Shoulders
- Pennant
- Rectangle
- Triangle
- Triple top
- All
- #AAPL
- #AMZN
- #Bitcoin
- #EBAY
- #FB
- #GOOG
- #INTC
- #KO
- #MA
- #MCD
- #MSFT
- #NTDOY
- #PEP
- #TSLA
- #TWTR
- AUDCAD
- AUDCHF
- AUDJPY
- AUDUSD
- EURCAD
- EURCHF
- EURGBP
- EURJPY
- EURNZD
- EURRUB
- EURUSD
- GBPAUD
- GBPCHF
- GBPJPY
- GBPUSD
- GOLD
- NZDCAD
- NZDCHF
- NZDJPY
- NZDUSD
- SILVER
- USDCAD
- USDCHF
- USDJPY
- USDRUB
- All
- M5
- M15
- M30
- H1
- D1
- All
- Buy
- Sale
- All
- 1
- 2
- 3
- 4
- 5

The Bullish pennant graphic pattern has formed on the #NTDOY M30 instrument. This pattern type falls under the category of continuation patterns. In this case, if the quote can breaks
Open chart in a new window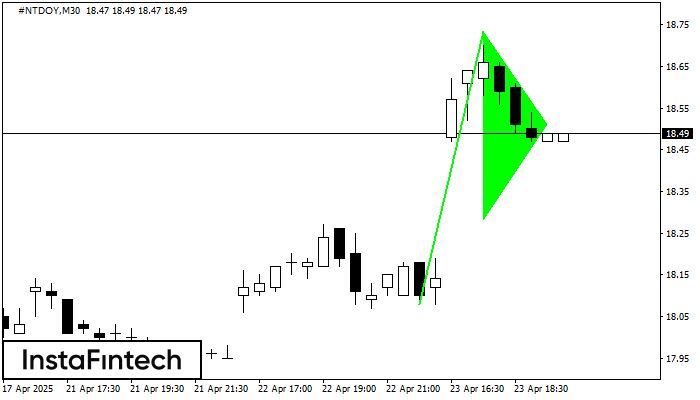
The Bullish pennant pattern is formed on the #NTDOY M30 chart. It is a type of the continuation pattern. Supposedly, in case the price is fixed above the pennant’s high
Open chart in a new window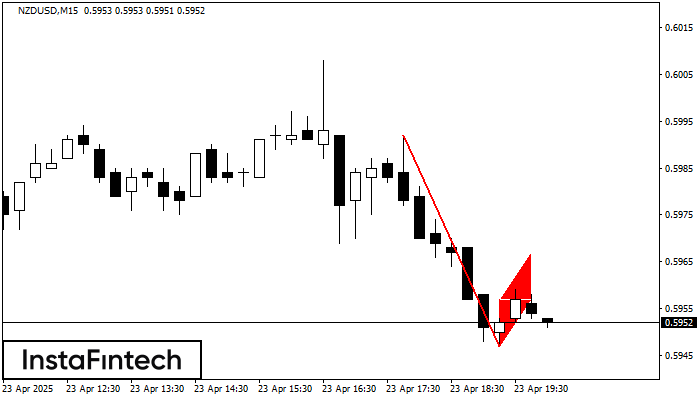
The Bearish Flag pattern has been formed on the chart NZDUSD M15. Therefore, the downwards trend is likely to continue in the nearest term. As soon as the price breaks
The M5 and M15 time frames may have more false entry points.
Open chart in a new window


