


signal strength 3 of 5
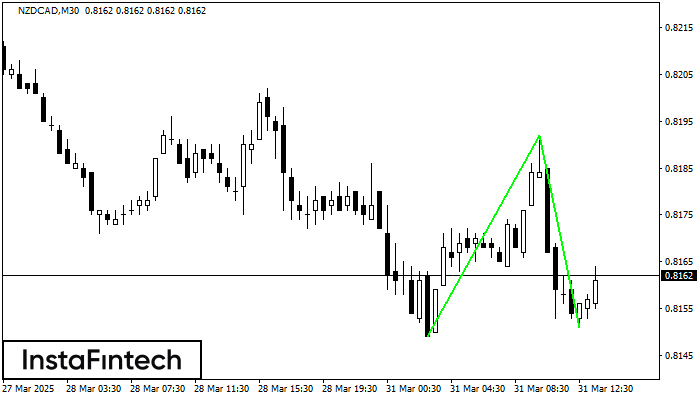
The Double Bottom pattern has been formed on NZDCAD M30. Characteristics: the support level 0.8149; the resistance level 0.8192; the width of the pattern 43 points. If the resistance level is broken, a change in the trend can be predicted with the first target point lying at the distance of 41 points.
- All
- Double Top
- Flag
- Head and Shoulders
- Pennant
- Rectangle
- Triangle
- Triple top
- All
- #AAPL
- #AMZN
- #Bitcoin
- #EBAY
- #FB
- #GOOG
- #INTC
- #KO
- #MA
- #MCD
- #MSFT
- #NTDOY
- #PEP
- #TSLA
- #TWTR
- AUDCAD
- AUDCHF
- AUDJPY
- AUDUSD
- EURCAD
- EURCHF
- EURGBP
- EURJPY
- EURNZD
- EURRUB
- EURUSD
- GBPAUD
- GBPCHF
- GBPJPY
- GBPUSD
- GOLD
- NZDCAD
- NZDCHF
- NZDJPY
- NZDUSD
- SILVER
- USDCAD
- USDCHF
- USDJPY
- USDRUB
- All
- M5
- M15
- M30
- H1
- D1
- All
- Buy
- Sale
- All
- 1
- 2
- 3
- 4
- 5
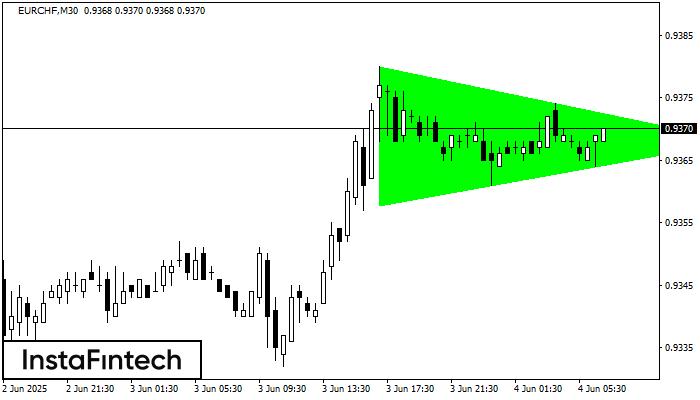
По EURCHF на M30 фигура «Бычий симметричный треугольник». Характеристика: Фигура продолжения тренда; Координаты границ – верхняя 0.9380, нижняя 0.9358. Проекция ширины фигуры 22 пунктов. Прогноз: В случае пробоя верхней границы
Открыть график инструмента в новом окне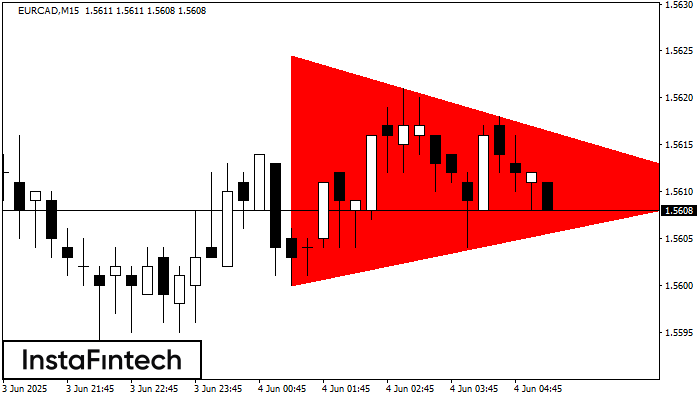
По EURCAD M15 сформировалась фигура «Медвежий симметричный треугольник». Данная фигура сигнализирует нам о продолжении нисходящего тренда в случае пробоя нижней границы 1.5600, где вероятная прибыль будет являться шириной текущей фигуры
Таймфреймы М5 и М15 могут иметь больше ложных точек входа.
Открыть график инструмента в новом окне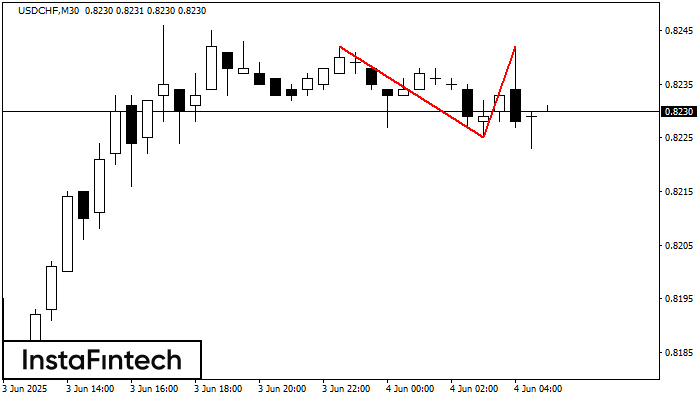
По USDCHF на M30 сформировалась разворотная фигура «Двойная вершина». Характеристика: Верхняя граница 0.8242; Нижняя граница 0.8225; Ширина фигуры 17 пунктов. Позицию на продажу возможно открыть ниже нижней границы 0.8225
Открыть график инструмента в новом окне


