

signal strength 1 of 5

The Bearish pennant pattern has formed on the AUDCHF M5 chart. The pattern signals continuation of the downtrend in case the pennant’s low of 0.5526 is broken through. Recommendations: Place the sell stop pending order 10 pips below the pattern’s low. Place the take profit order at the projection distance of the flagpole height.
The M5 and M15 time frames may have more false entry points.
انظر أيضا
- All
- Double Top
- Flag
- Head and Shoulders
- Pennant
- Rectangle
- Triangle
- Triple top
- All
- #AAPL
- #AMZN
- #Bitcoin
- #EBAY
- #FB
- #GOOG
- #INTC
- #KO
- #MA
- #MCD
- #MSFT
- #NTDOY
- #PEP
- #TSLA
- #TWTR
- AUDCAD
- AUDCHF
- AUDJPY
- AUDUSD
- EURCAD
- EURCHF
- EURGBP
- EURJPY
- EURNZD
- EURRUB
- EURUSD
- GBPAUD
- GBPCHF
- GBPJPY
- GBPUSD
- GOLD
- NZDCAD
- NZDCHF
- NZDJPY
- NZDUSD
- SILVER
- USDCAD
- USDCHF
- USDJPY
- USDRUB
- All
- M5
- M15
- M30
- H1
- D1
- All
- Buy
- Sale
- All
- 1
- 2
- 3
- 4
- 5
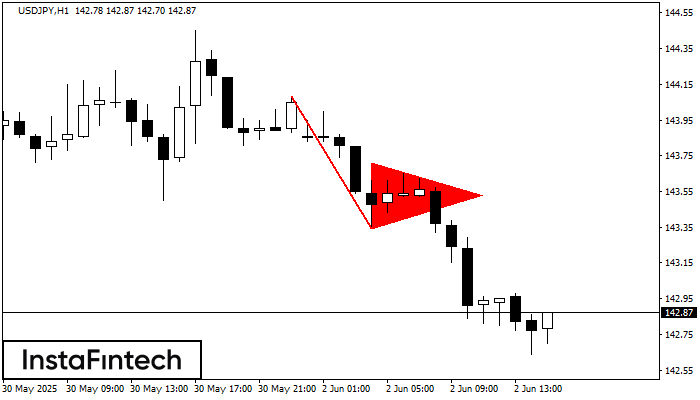
The Bearish pennant pattern has formed on the USDJPY H1 chart. It signals potential continuation of the existing trend. Specifications: the pattern’s bottom has the coordinate of 143.34; the projection
Открыть график инструмента в новом окне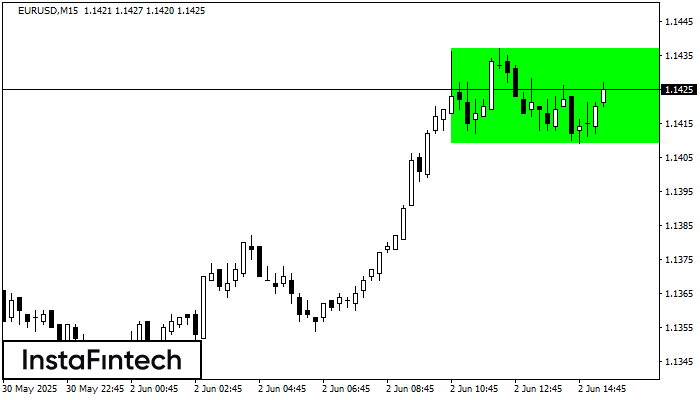
According to the chart of M15, EURUSD formed the Bullish Rectangle which is a pattern of a trend continuation. The pattern is contained within the following borders: the lower border
The M5 and M15 time frames may have more false entry points.
Открыть график инструмента в новом окне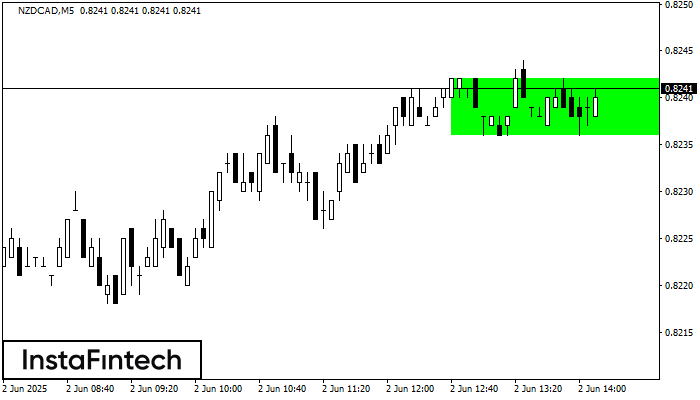
According to the chart of M5, NZDCAD formed the Bullish Rectangle. The pattern indicates a trend continuation. The upper border is 0.8242, the lower border is 0.8236. The signal means
The M5 and M15 time frames may have more false entry points.
Открыть график инструмента в новом окне


