


signal strength 1 of 5
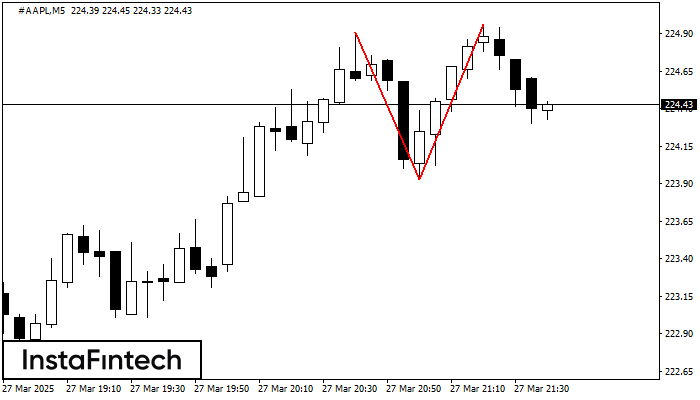
The Double Top pattern has been formed on #AAPL M5. It signals that the trend has been changed from upwards to downwards. Probably, if the base of the pattern 223.93 is broken, the downward movement will continue.
The M5 and M15 time frames may have more false entry points.
انظر أيضا
- All
- Double Top
- Flag
- Head and Shoulders
- Pennant
- Rectangle
- Triangle
- Triple top
- All
- #AAPL
- #AMZN
- #Bitcoin
- #EBAY
- #FB
- #GOOG
- #INTC
- #KO
- #MA
- #MCD
- #MSFT
- #NTDOY
- #PEP
- #TSLA
- #TWTR
- AUDCAD
- AUDCHF
- AUDJPY
- AUDUSD
- EURCAD
- EURCHF
- EURGBP
- EURJPY
- EURNZD
- EURRUB
- EURUSD
- GBPAUD
- GBPCHF
- GBPJPY
- GBPUSD
- GOLD
- NZDCAD
- NZDCHF
- NZDJPY
- NZDUSD
- SILVER
- USDCAD
- USDCHF
- USDJPY
- USDRUB
- All
- M5
- M15
- M30
- H1
- D1
- All
- Buy
- Sale
- All
- 1
- 2
- 3
- 4
- 5
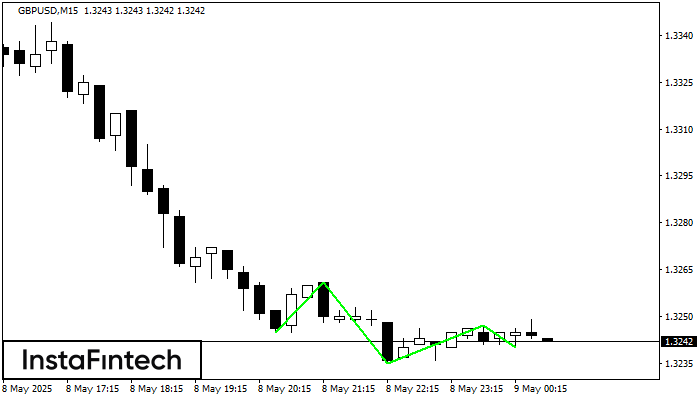
The Triple Bottom pattern has formed on the chart of GBPUSD M15. Features of the pattern: The lower line of the pattern has coordinates 1.3261 with the upper limit 1.3261/1.3247
The M5 and M15 time frames may have more false entry points.
Open chart in a new window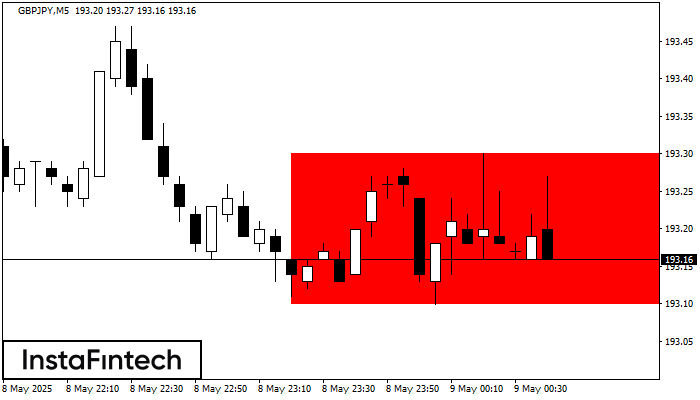
According to the chart of M5, GBPJPY formed the Bearish Rectangle. The pattern indicates a trend continuation. The upper border is 193.30, the lower border is 193.10. The signal means
The M5 and M15 time frames may have more false entry points.
Open chart in a new window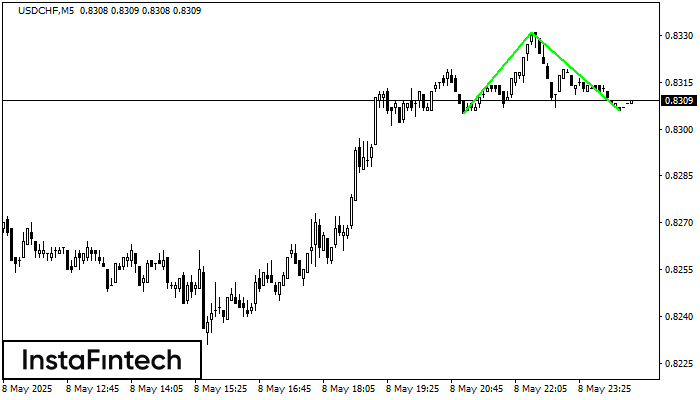
The Double Bottom pattern has been formed on USDCHF M5; the upper boundary is 0.8331; the lower boundary is 0.8306. The width of the pattern is 26 points. In case
The M5 and M15 time frames may have more false entry points.
Open chart in a new window


