empty
23.01.2024 10:25 AM
EUR/USD and GBP/USD: trading tips for beginners on January 23

Details of economic calendar on January 22

The economic calendar commonly lacks high-impact economic data on Monday. Yesterday was no exception. The US, the UK, and the EU did not release any economic reports.

Analysis of technical charts on January 22

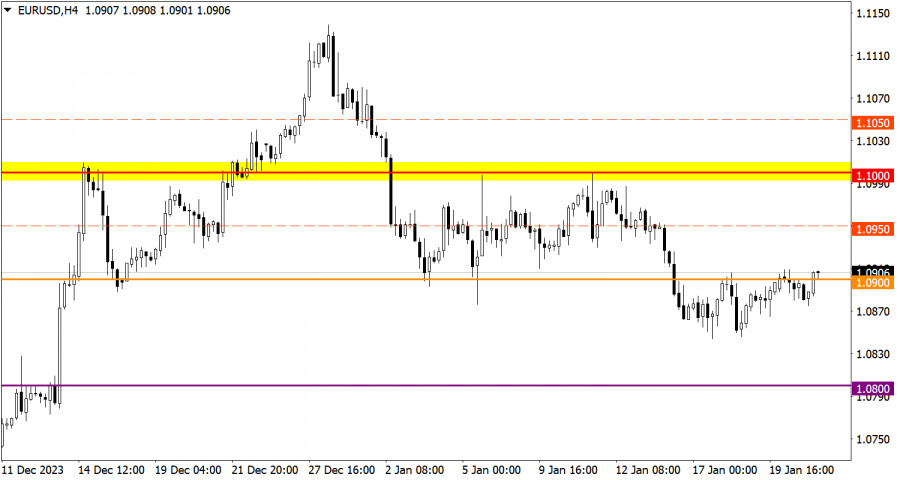
The EUR/USD pair has been moving around the 1.0900 level for the third day in a row with low trading activity. The level of 1.0850 serves as a variable support on the path of sellers. At this level, there was a reduction in short positions on EUR/USD.

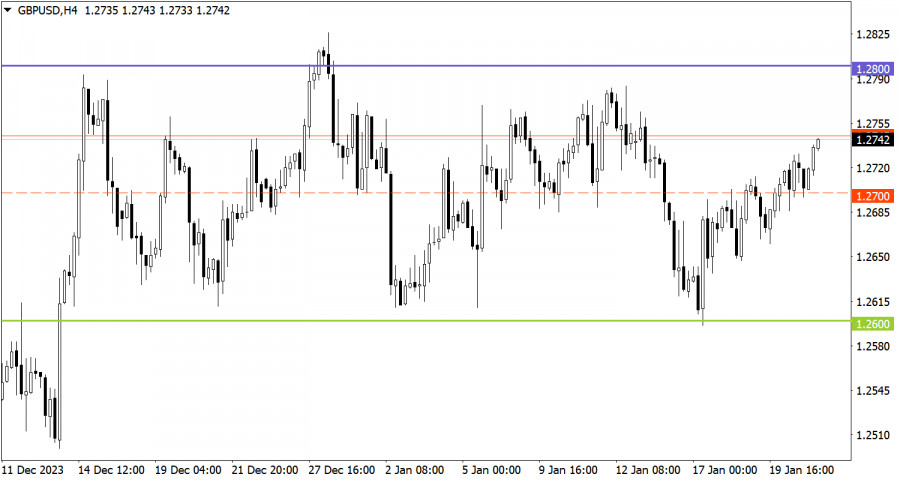
The GBP/USD currency pair is trading within the sideways channel of 1.2600/1.2800, consistently approaching the defined borders. At the moment, we see the consolidation above the average level of 1.2700, which indicates an increase in long positions on the range-bound market.

This image is no longer relevant

Economic calendar on January 23

Today the economic calendar is equally empty as on Monday. No macroeconomic data will be released in the US, the UK, and the EU.

Trading plan for EUR/USD on January 23

Consolidation of the price above 1.0900 during the day may lead to an increase in the volume of long positions in the direction towards 1.1000. As for the bearish scenario, it will come into play if the price drops below 1.0850.

This image is no longer relevant

Trading plan for GBP/USD on January 23

In this situation, we may go ahead trading within the borders of the sideways channel. We reckon the instrument could approach the upper border at 1.2800.

However, we should not forget that the range-bound market is a temporary pattern, which leads to the accumulation of trading forces and abundant attention from speculators. As a result, the instrument will gain a certain momentum and break any of the borders. When the flat market is over, the price will indicate a further direction in the market. For this reason, you should always consider the breakout strategy.

This image is no longer relevant

What's on charts

The candlestick chart type consists of graphic rectangles in white and black with lines at the top and bottom. With a detailed analysis of each individual candle, you can see its characteristics relative to a particular time frame: opening price, closing price, maximum and minimum price.

Horizontal levels are price coordinates relative to which a price may stop or revered its trajectory. In the market, these levels are called support and resistance.

Circles and rectangles are highlighted examples where the price developed. This color highlighting indicates horizontal lines that may put pressure on the price in the future.

Up/down arrows are guidelines for possible price direction in the future.

Gven Podolsky,
الخبير التحليلي لدى شركة إنستافوركس
© 2007-2025
حدد الإطار الزمني
5
د
15
د
30
د
1
س
4
ساعات
1
يوم
1
أسبوع
كسب عائد من تغيرات أسعار العملات المشفرة مع إنستافوركس.
قم بتحميل منصة التداول ميتاتريدر 4 وافتح أول صفقة.
  • Grand Choice
    Contest by
    InstaForex
    InstaForex always strives to help you
    fulfill your biggest dreams.
    انضم إلى المسابقة

المقالات الموصى بها

توصيات وتحليل التداول لزوج الجنيه الإسترليني/الدولار الأمريكي في 27 مارس: تراجع الجنيه، لكن لم يتغير شيء

تداول زوج العملات GBP/USD بانخفاض يوم الأربعاء. كنا قد حذرنا من أن الزوج كان يتأرجح مؤخرًا مثل البندول. كان الجنيه يرتفع يوم الثلاثاء، لذا كان من الممكن أن ينخفض بسرعة

Paolo Greco 03:06 2025-03-27 UTC+2

توصيات وتحليل التداول لزوج اليورو/الدولار الأمريكي في 27 مارس: السوق ليست في عجلة من أمرها

تداول زوج العملات EUR/USD بخسائر طفيفة طوال يوم الأربعاء، بينما يظل الاتجاه العام على الإطار الزمني للساعة هابطًا بعد خروج السعر من القناة الصاعدة. تراجع اليورو ضعيف، مع ارتدادات متكررة،

Paolo Greco 03:06 2025-03-27 UTC+2

GBP/USD: خطة التداول للجلسة الأمريكية في 26 مارس (مراجعة التداولات الصباحية)

في توقعاتي الصباحية، قمت بتسليط الضوء على مستوى 1.2926 وخططت لاتخاذ قرارات التداول بناءً عليه. دعونا نلقي نظرة على الرسم البياني لمدة 5 دقائق ونحلل ما حدث. قدم الاختراق وإعادة

Miroslaw Bawulski 17:24 2025-03-26 UTC+2

EUR/USD: خطة التداول للجلسة الأمريكية في 26 مارس (مراجعة التداولات الصباحية)

في توقعاتي الصباحية، قمت بتسليط الضوء على مستوى 1.0780 وخططت لاتخاذ قرارات دخول السوق بناءً عليه. دعونا نلقي نظرة على الرسم البياني لمدة 5 دقائق ونحلل ما حدث. على الرغم

Miroslaw Bawulski 17:21 2025-03-26 UTC+2

كيفية تداول زوج الجنيه الإسترليني/الدولار الأمريكي في 26 مارس؟ نصائح بسيطة وتحليل التداول للمبتدئين

في يوم الثلاثاء، تداول زوج الجنيه الإسترليني/الدولار الأمريكي بزيادة طفيفة، لكن الحركة العامة في الأسابيع الأخيرة تشبه بشكل متزايد سوقًا مسطحًا. القناة الجانبية المفترضة ليس لها حدود محددة بوضوح،

Paolo Greco 05:55 2025-03-26 UTC+2

كيفية تداول زوج اليورو/الدولار الأمريكي في 26 مارس؟ نصائح بسيطة وتحليل التداول للمبتدئين

في يوم الثلاثاء، واصل زوج العملات EUR/USD حركته الضعيفة نحو الانخفاض. يمكن ملاحظة ذلك في أي رسم بياني لأي إطار زمني، بعد ارتفاع قوي وطويل الأمد لليورو - والذي يمثل

Paolo Greco 05:55 2025-03-26 UTC+2

توصيات وتحليلات التداول لزوج الجنيه الإسترليني/الدولار الأمريكي في 26 مارس: الجنيه يواصل التأرجح

أظهر زوج العملات GBP/USD نموًا مرة أخرى يوم الثلاثاء. "مرة أخرى"، لأن جميع تحركات العملة البريطانية مؤخرًا تشبه "الأرجوحة" أو "الأفعوانية" - أولاً صعودًا، ثم هبوطًا. علاوة على ذلك،

Paolo Greco 02:40 2025-03-26 UTC+2

توصيات وتحليلات التداول لليورو/الدولار الأمريكي في 26 مارس: يواصل اليورو تراجعه البطيء

تداول زوج العملات EUR/USD بزيادات طفيفة فقط يوم الثلاثاء، لكن الاتجاه العام على الإطار الزمني الساعي لا يزال هابطًا بعد خروج السعر من القناة الصاعدة. تراجع اليورو ضعيف نسبيًا،

Paolo Greco 02:40 2025-03-26 UTC+2

GBP/USD: خطة التداول للجلسة الأمريكية في 25 مارس (مراجعة تداولات الصباح)

في توقعاتي الصباحية، لفتُّ الانتباه إلى مستوى 1.2948 وخططت لاتخاذ قرارات التداول بناءً عليه. دعونا نلقي نظرة على الرسم البياني لمدة 5 دقائق ونرى ما حدث. الارتفاع الذي تلاه اختراق

Miroslaw Bawulski 18:15 2025-03-25 UTC+2

EUR/USD: خطة التداول للجلسة الأمريكية في 25 مارس (مراجعة تداولات الصباح)

في توقعاتي الصباحية، قمت بتسليط الضوء على مستوى 1.0779 وخططت لاتخاذ قرارات التداول بناءً عليه. دعونا نلقي نظرة على الرسم البياني لمدة 5 دقائق ونفحص ما حدث هناك. الانخفاض وتشكيل

Miroslaw Bawulski 18:13 2025-03-25 UTC+2
لا تستطيع التحدث الآن؟
اطرح سؤالك في الدردشة.
Widget callback
 

Dear visitor,

Your IP address shows that you are currently located in the USA. If you are a resident of the United States, you are prohibited from using the services of InstaFintech Group including online trading, online transfers, deposit/withdrawal of funds, etc.

If you think you are seeing this message by mistake and your location is not the US, kindly proceed to the website. Otherwise, you must leave the website in order to comply with government restrictions.

Why does your IP address show your location as the USA?

  • - you are using a VPN provided by a hosting company based in the United States;
  • - your IP does not have proper WHOIS records;
  • - an error occurred in the WHOIS geolocation database.

Please confirm whether you are a US resident or not by clicking the relevant button below. If you choose the wrong option, being a US resident, you will not be able to open an account with InstaForex anyway.

We are sorry for any inconvenience caused by this message.