empty
18.12.2023 09:40 AM
EUR/USD and GBP/USD: Trading plan for beginner traders on December 18, 2023

Details of the Economic Calendar on December 15

Preliminary assessment of business activity indices in the Eurozone significantly fell short of forecasts, showing a decline. The manufacturing sector's business activity index remained at the same level instead of the expected increase from 44.2 to 44.4. The services sector also decreased from 48.7 to 48.1, despite a forecast of 49.3. The composite business activity index, anticipated to rise from 47.6 to 48.0, fell to 47. These weak results led to an immediate weakening of the European currency.

Interestingly, this sentiment continued after the opening of the American trading session despite somewhat better data from the United States. The manufacturing sector's business activity index dropped from 49.4 to 48.2, slightly worse than the forecast of 49.2. However, the services sector's business activity index increased from 50.8 to 51.3, reversing the situation. The composite business activity index also rose from 50.7 to 51.0, against the expected decrease to 50.5. Industrial production showed a slowdown in the pace of decline from -1.0% to -0.4%, slightly worse than the forecast of -0.3%.

This image is no longer relevant

Analysis of Trading Charts from December 15

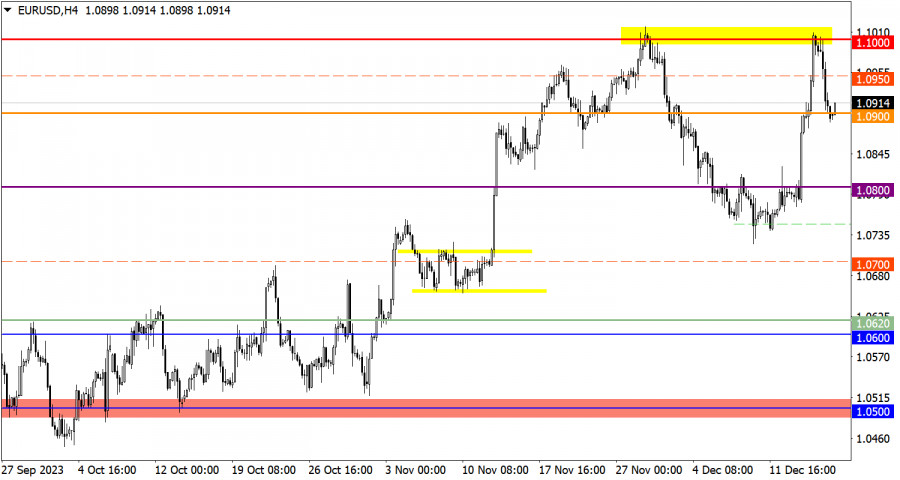
The euro reduced the volume of long positions near the resistance level of 1.1000, leading to a pullback, and the quote returned to the 1.0900 mark.

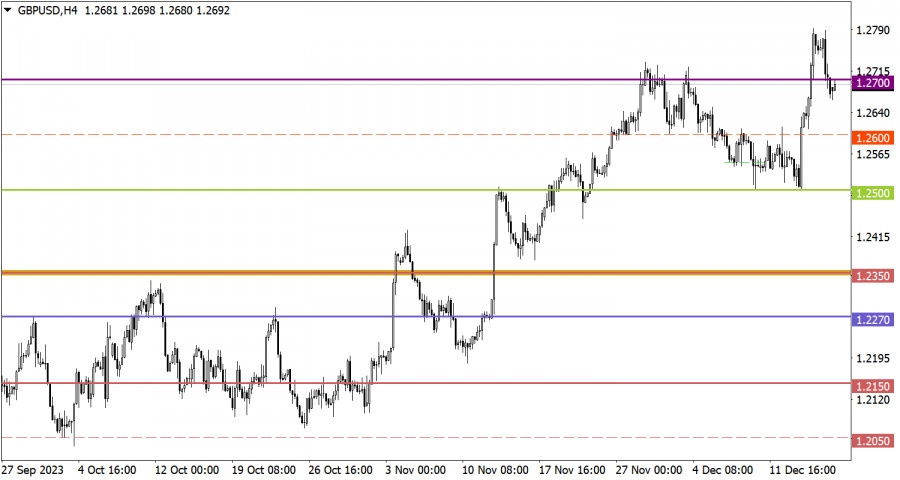
The British pound, in turn, entered a pullback stage due to a technical overbought signal. The area around the value of 1.2800 acted as resistance on the buyers' path.

Economic Calendar for December 18

As usual, Monday is accompanied by an empty macroeconomic calendar, and there are no publications of important statistical data in the European Union, the United Kingdom, and the United States.

EUR/USD Trading Plan for December 18

Stabilization of the price above the level of 1.0900 in the perspective may indicate an increase in the volume of long positions. In this case, a recovery of the upward trend towards 1.1000 is possible. However, if the price remains below the value of 1.0900 during the day, this may lead to further declines, canceling the recent rise.

This image is no longer relevant

GBP/USD Trading Plan for December 18

Despite the current pullback stage, there is still an upward dynamic in the market. Therefore, price stabilization above the level of 1.2700 may trigger the resumption of long positions, leading to the update of the local high. Regarding the current pullback, prolonged holding of the price below 1.2650 may lead to subsequent depreciation of the British pound towards 1.2600.

This image is no longer relevant

What's on the charts

The candlestick chart type is white and black graphic rectangles with lines above and below. With a detailed analysis of each individual candle, you can see its characteristics relative to a particular time frame: opening price, closing price, intraday high and low.

Horizontal levels are price coordinates, relative to which a price may stop or reverse its trajectory. In the market, these levels are called support and resistance.

Circles and rectangles are highlighted examples where the price reversed in history. This color highlighting indicates horizontal lines that may put pressure on the asset's price in the future.

The up/down arrows are landmarks of the possible price direction in the future.

Gven Podolsky,
الخبير التحليلي لدى شركة إنستافوركس
© 2007-2025
حدد الإطار الزمني
5
د
15
د
30
د
1
س
4
ساعات
1
يوم
1
أسبوع
كسب عائد من تغيرات أسعار العملات المشفرة مع إنستافوركس.
قم بتحميل منصة التداول ميتاتريدر 4 وافتح أول صفقة.
  • Grand Choice
    Contest by
    InstaForex
    InstaForex always strives to help you
    fulfill your biggest dreams.
    انضم إلى المسابقة

المقالات الموصى بها

GBP/USD: خطة التداول للجلسة الأمريكية في 3 يونيو (مراجعة التداولات الصباحية)

في توقعاتي الصباحية، أشرت إلى مستوى 1.3517 وخططت لاتخاذ قرارات التداول بناءً عليه. دعونا نلقي نظرة على الرسم البياني لمدة 5 دقائق ونحلل ما حدث. أدى الانخفاض والاختراق الكاذب

Miroslaw Bawulski 18:47 2025-06-03 UTC+2

EUR/USD: خطة التداول للجلسة الأمريكية في 3 يونيو (مراجعة التداولات الصباحية)

في توقعاتي الصباحية، أشرت إلى مستوى 1.1404 وخططت لاتخاذ قرارات التداول بناءً عليه. دعونا نلقي نظرة على الرسم البياني لمدة 5 دقائق ونرى ما حدث. أدى الانخفاض والاختراق الكاذب

Miroslaw Bawulski 18:32 2025-06-03 UTC+2

كيف تتداول زوج الجنيه الإسترليني/الدولار الأمريكي في 3 يونيو؟ نصائح بسيطة وتحليل التداول للمبتدئين

تداول زوج الجنيه الإسترليني/الدولار الأمريكي أيضًا بارتفاع طوال يوم الاثنين. ومع ذلك، فإن الصورة الفنية العامة للجنيه الإسترليني تختلف قليلاً عن اليورو. نعم، الجنيه يرتفع مثل اليورو، بل وبقوة أكبر

Paolo Greco 06:27 2025-06-03 UTC+2

كيفية تداول زوج اليورو/الدولار الأمريكي في 3 يونيو؟ نصائح بسيطة وتحليل التداول للمبتدئين

تداول زوج العملات اليورو/الدولار الأمريكي بارتفاع يوم الاثنين. كنا قد حذرنا من أن الدولار من المحتمل أن يتراجع مرة أخرى بعد أن أعلن ترامب عن زيادة التعريفات الجمركية على واردات

Paolo Greco 06:27 2025-06-03 UTC+2

توصيات وتحليل التداول لزوج الجنيه الإسترليني/الدولار الأمريكي في 3 يونيو: الجنيه استحوذ على آخر

كما حذرنا، تداول زوج العملات GBP/USD بقوة يوم الاثنين. الدولار الأمريكي لم يتأثر بشكل كبير، حيث كان من الممكن أن يكون الانخفاض أكثر حدة. شهد المتداولون جولة جديدة من التصعيد

Paolo Greco 03:57 2025-06-03 UTC+2

توصيات وتحليل التداول لليورو/الدولار الأمريكي في 3 يونيو: ترامب وISM يضغطان على الدولار

أظهر زوج العملات EUR/USD حركة صعودية قوية إلى حد ما يوم الاثنين. كما كان متوقعًا، بدأ الدولار الأمريكي في الانخفاض منذ افتتاح السوق ليلة الاثنين. ماذا كان يمكن أن يُتوقع

Paolo Greco 03:57 2025-06-03 UTC+2

GBP/USD: خطة التداول للجلسة الأمريكية في 2 يونيو (مراجعة تداولات الصباح)

في توقعاتي الصباحية، ركزت على مستوى 1.3555 وخططت لاتخاذ قرارات دخول السوق بناءً عليه. دعونا نلقي نظرة على الرسم البياني لمدة 5 دقائق ونحلل ما حدث. أدى الارتفاع يليه اختراق

Miroslaw Bawulski 18:50 2025-06-02 UTC+2

EUR/USD: خطة التداول للجلسة الأمريكية في 2 يونيو (مراجعة تداولات الصباح)

في توقعاتي الصباحية، ركزت على مستوى 1.1416 وخططت لاتخاذ قرارات دخول السوق بناءً عليه. دعونا نلقي نظرة على الرسم البياني لمدة 5 دقائق ونحلل ما حدث. أدى اختراق وإعادة اختبار

Miroslaw Bawulski 18:47 2025-06-02 UTC+2

كيفية تداول زوج الجنيه الإسترليني/الدولار الأمريكي في 2 يونيو؟ نصائح بسيطة وتحليل التداول للمبتدئين

تداول زوج الجنيه الإسترليني/الدولار الأمريكي بهدوء نسبي طوال يوم الجمعة. لم تكن هناك أخبار أو أحداث مهمة في ذلك اليوم، لذا كانت التقلبات 65 نقطة فقط. كسر الزوج خط الاتجاه

Paolo Greco 06:08 2025-06-02 UTC+2

كيفية تداول زوج اليورو/الدولار الأمريكي في 2 يونيو؟ نصائح بسيطة وتحليل التداول للمبتدئين

تداول زوج العملات اليورو/الدولار الأمريكي بهدوء أكبر يوم الجمعة مقارنة بيوم الخميس. وهذا ليس مفاجئًا، حيث كان الخلفية الاقتصادية الكلية ضعيفة، وقد استوعب السوق كل المعلومات من يوم الخميس

Paolo Greco 06:08 2025-06-02 UTC+2
لا تستطيع التحدث الآن؟
اطرح سؤالك في الدردشة.
Widget callback
 

Dear visitor,

Your IP address shows that you are currently located in the USA. If you are a resident of the United States, you are prohibited from using the services of InstaFintech Group including online trading, online transfers, deposit/withdrawal of funds, etc.

If you think you are seeing this message by mistake and your location is not the US, kindly proceed to the website. Otherwise, you must leave the website in order to comply with government restrictions.

Why does your IP address show your location as the USA?

  • - you are using a VPN provided by a hosting company based in the United States;
  • - your IP does not have proper WHOIS records;
  • - an error occurred in the WHOIS geolocation database.

Please confirm whether you are a US resident or not by clicking the relevant button below. If you choose the wrong option, being a US resident, you will not be able to open an account with InstaForex anyway.

We are sorry for any inconvenience caused by this message.