empty
22.11.2023 11:10 AM
EUR/USD and GBP/USD: Trading plan for beginner traders on November 22, 2023

Details of the Economic Calendar on November 21

Existing home sales in the United States declined 4.1% in October, reaching 3.79 million—the lowest figure since August 2010.

The reduction has been recorded for the fifth consecutive month and was caused by the rise in mortgage rates and housing prices.

Analysis of Trading Charts from November 21

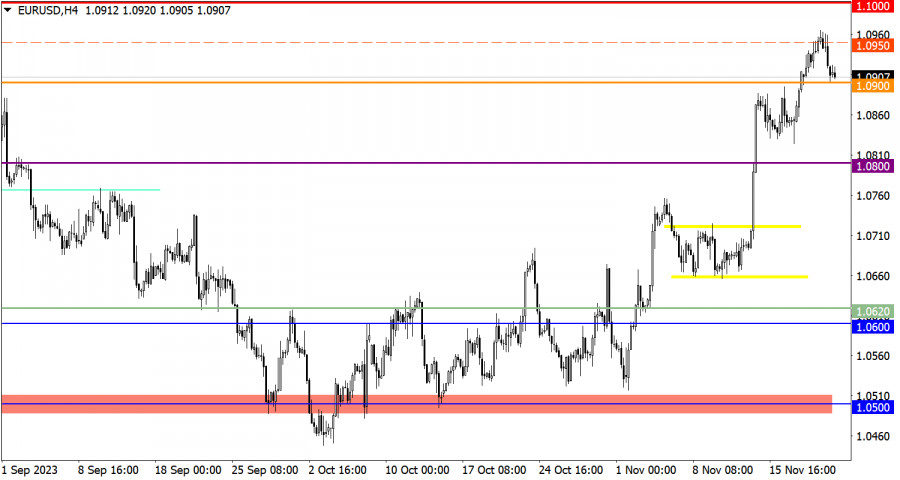
The EUR/USD currency pair, in the course of inertial-speculative movement, reached the lower range of the psychological level of 1.0950/1.1000. As a result, there was a reduction in the volume of long positions, leading to a price pullback. This movement is considered justified in the market due to the overbought status of the euro.

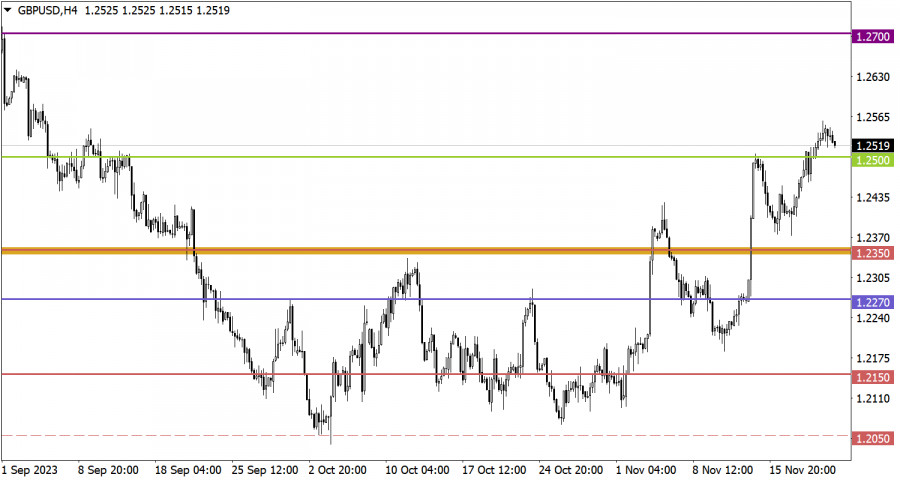
The GBP/USD pair reached the level of 1.2550, but due to an obvious technical signal of overbought conditions, a reduction in the volume of long positions could be observed, primarily leading to a slowdown in the upward cycle, and then to a pullback.

This image is no longer relevant

Economic Calendar on November 22

Today, the publication of data on orders for durable goods in the United States is expected, with an anticipated decrease of 2.8%. In addition, the overall number of unemployment benefit claims may rise by 5,000. In general, there is nothing positive, and everything indicates further weakening of the dollar. However, tomorrow is a holiday in the United States for Thanksgiving, and this may lead to the fixation of trading positions in favor of the dollar; in this case, negative statistics will not affect the market.

EUR/USD Trading Plan for November 22

To further increase the volume of short positions, it is necessary to keep the price below the level of 1.0900. In this case, a transition from the pullback stage to a full-scale correction is possible. An alternative scenario considers a reduction in the volume of short positions around the level of 1.0900, treating it as support. In this scenario, another attempt to break the psychological level of 1.1000 is possible.

This image is no longer relevant

GBP/USD Trading Plan for November 22

In the case of further building a pullback stage, the quote can at least drop to the level of 1.2500. The subsequent price movement will depend on how market participants behave near this level. Two possible scenarios will be considered. The first is based on the rebound tactic, where the level of 1.2500 will be played as support, strengthening long positions. The second scenario considers a transition from the pullback stage to a full-scale correction. In this case, the level of 1.2500 will be broken.

This image is no longer relevant

What's on the charts

The candlestick chart type is white and black graphic rectangles with lines above and below. With a detailed analysis of each individual candle, you can see its characteristics relative to a particular time frame: opening price, closing price, intraday high and low.

Horizontal levels are price coordinates, relative to which a price may stop or reverse its trajectory. In the market, these levels are called support and resistance.

Circles and rectangles are highlighted examples where the price reversed in history. This color highlighting indicates horizontal lines that may put pressure on the asset's price in the future.

The up/down arrows are landmarks of the possible price direction in the future.

Gven Podolsky,
الخبير التحليلي لدى شركة إنستافوركس
© 2007-2025
حدد الإطار الزمني
5
د
15
د
30
د
1
س
4
ساعات
1
يوم
1
أسبوع
كسب عائد من تغيرات أسعار العملات المشفرة مع إنستافوركس.
قم بتحميل منصة التداول ميتاتريدر 4 وافتح أول صفقة.
  • Grand Choice
    Contest by
    InstaForex
    InstaForex always strives to help you
    fulfill your biggest dreams.
    انضم إلى المسابقة

المقالات الموصى بها

توصيات وتحليلات التداول لزوج الجنيه الإسترليني/الدولار الأمريكي في 10 يونيو: الجنيه ليس في عجلة من أمره للهبوط أيضًا

في يوم الاثنين، فشل زوج العملات GBP/USD بشكل متوقع في مواصلة حركته الهبوطية. نذكر أنه في وقت سابق، شكل السعر مرة أخرى إشارة لانعكاس الاتجاه إلى الاتجاه الهبوطي

Paolo Greco 04:11 2025-06-10 UTC+2

توصيات وتحليل التداول لليورو/الدولار الأمريكي في 10 يونيو: يوم آخر، وجرعة أخرى من السلبية

تداول زوج العملات EUR/USD بشكل متباين طوال يوم الاثنين. وعلى الرغم من كسر خط الاتجاه، إلا أن الحركة الهبوطية (أي تقوية الدولار الأمريكي) لم تبدأ فعليًا. وبالتالي، لا تزال الإشارات

Paolo Greco 04:11 2025-06-10 UTC+2

GBP/USD: خطة التداول للجلسة الأمريكية في 9 يونيو (تحليل التداولات الصباحية)

في توقعاتي الصباحية، ركزت على مستوى 1.3581 وخططت لاتخاذ قرارات الدخول بناءً عليه. دعونا نلقي نظرة على الرسم البياني لمدة 5 دقائق ونرى ما حدث. الارتفاع وتشكيل اختراق كاذب

Miroslaw Bawulski 14:16 2025-06-09 UTC+2

EUR/USD: خطة التداول للجلسة الأمريكية في 9 يونيو (تحليل التداولات الصباحية)

في توقعاتي الصباحية، ركزت على مستوى 1.1430 وخططت لاتخاذ قرارات الدخول بناءً عليه. دعونا نلقي نظرة على الرسم البياني لمدة 5 دقائق ونرى ما حدث. ارتفع الزوج وشكل اختراقًا كاذبًا

Miroslaw Bawulski 14:09 2025-06-09 UTC+2

كيف تتداول زوج الجنيه الإسترليني/الدولار الأمريكي في 9 يونيو؟ نصائح بسيطة وتحليل التداول للمبتدئين

تداول زوج الجنيه الإسترليني/الدولار الأمريكي أيضًا بانخفاض يوم الجمعة لنفس الأسباب التي أدت إلى انخفاض زوج اليورو/الدولار الأمريكي. تلقى الدولار دعمًا محدودًا من السوق بسبب البيانات الاقتصادية الجيدة من الجانب

Paolo Greco 05:54 2025-06-09 UTC+2

كيفية تداول زوج اليورو/الدولار الأمريكي في 9 يونيو؟ نصائح بسيطة وتحليل التداول للمبتدئين

تداول زوج العملات اليورو/الدولار الأمريكي بانخفاض يوم الجمعة، وكانت هناك أسباب موضوعية لذلك. ومع ذلك، من المهم ملاحظة أنه بحلول نهاية اليوم، كان الدولار قد تعزز بمقدار "كامل" 50 نقطة

Paolo Greco 05:54 2025-06-09 UTC+2

توصيات وتحليل التداول لزوج الجنيه الإسترليني/الدولار الأمريكي في 9 يونيو: الجنيه يغير الاتجاه مرة أخرى

يوم الجمعة، كان زوج العملات GBP/USD يتداول بانخفاض، وبما أن خط الاتجاه كان قريبًا جدًا من السعر، كان حتى الانخفاض الطفيف كافيًا لاختراقه. نذكر أنه قبل 10 أيام، أظهرت الجنيه

Paolo Greco 03:33 2025-06-09 UTC+2

توصيات وتحليل التداول لزوج اليورو/الدولار الأمريكي في 9 يونيو: إلى متى سيستمر نمو الدولار هذه المرة؟

يوم الجمعة، واصل زوج العملات EUR/USD انخفاضه الطفيف نسبيًا وأنهى اليوم بالقرب من خط الاتجاه الصاعد المألوف. نذكر أنه قبل حوالي 10 أيام، تم كسر هذا الخط، مما أشار

Paolo Greco 03:33 2025-06-09 UTC+2

GBP/USD: خطة التداول للجلسة الأمريكية في 6 يونيو (مراجعة تداولات الصباح)

في توقعاتي الصباحية، قمت بتسليط الضوء على مستوى 1.3544 وخططت لاتخاذ قرارات دخول السوق بناءً عليه. دعونا نلقي نظرة على الرسم البياني لمدة 5 دقائق ونرى ما حدث. حدث انخفاض

Miroslaw Bawulski 15:38 2025-06-06 UTC+2

EUR/USD: خطة التداول للجلسة الأمريكية في 6 يونيو (مراجعة التداولات الصباحية)

في توقعاتي الصباحية، قمت بتسليط الضوء على مستوى 1.1407 وخططت لاتخاذ قرارات دخول السوق بناءً عليه. دعونا نلقي نظرة على الرسم البياني لمدة 5 دقائق ونرى ما حدث. كان هناك

Miroslaw Bawulski 15:36 2025-06-06 UTC+2
لا تستطيع التحدث الآن؟
اطرح سؤالك في الدردشة.
Widget callback
 

Dear visitor,

Your IP address shows that you are currently located in the USA. If you are a resident of the United States, you are prohibited from using the services of InstaFintech Group including online trading, online transfers, deposit/withdrawal of funds, etc.

If you think you are seeing this message by mistake and your location is not the US, kindly proceed to the website. Otherwise, you must leave the website in order to comply with government restrictions.

Why does your IP address show your location as the USA?

  • - you are using a VPN provided by a hosting company based in the United States;
  • - your IP does not have proper WHOIS records;
  • - an error occurred in the WHOIS geolocation database.

Please confirm whether you are a US resident or not by clicking the relevant button below. If you choose the wrong option, being a US resident, you will not be able to open an account with InstaForex anyway.

We are sorry for any inconvenience caused by this message.