empty
06.02.2023 11:49 AM
EUR/USD and GBP/USD technical analysis on February 6, 2023

EUR/USD

This image is no longer relevant

Higher time frames

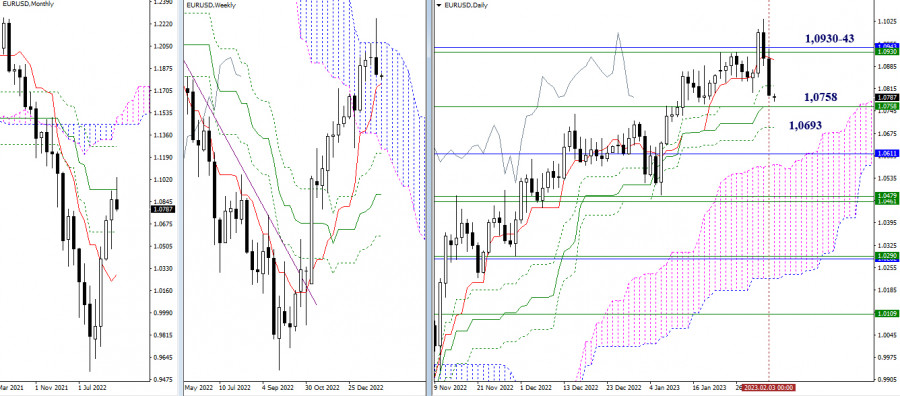
Last week, the pair bounced off the resistance area at 1.0930-43 which coincided with the upper boundary of the weekly Ichimoku Cloud and the monthly medium-term trend. To confirm a rebound and extend it further to the downside, bears need to overcome the support of the weekly short-term trend at 1.0758 and cancel the Golden Cross at 1.0758 – 1.0693.

This image is no longer relevant

H4 – H1

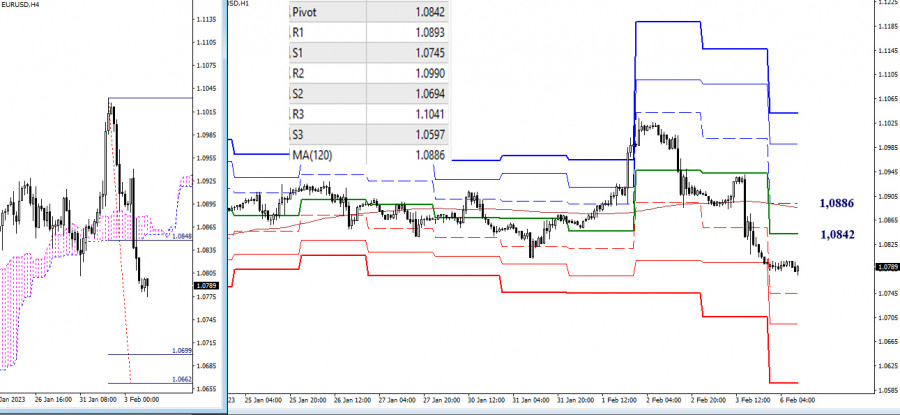
At the moment, bears have seized the initiative on lower time frames. Their downward targets for today are found at the standard pivot levels of 1.0745 – 1.0694 – 1.0597. Another target is the breakout point of the H4 Ichimoku Cloud at 1.0699 – 1.0692. Notably, the support zones on lower time frames are fortified by the support area on longer time periods at 1.0758 – 1.0693. The resistance is now formed by the key levels of the standard pivot point at 1.0842 and the weekly long-term trend at 1.0886. A firm hold above this price range may change the market balance.

***

GBP/USD

This image is no longer relevant

Higher time frames

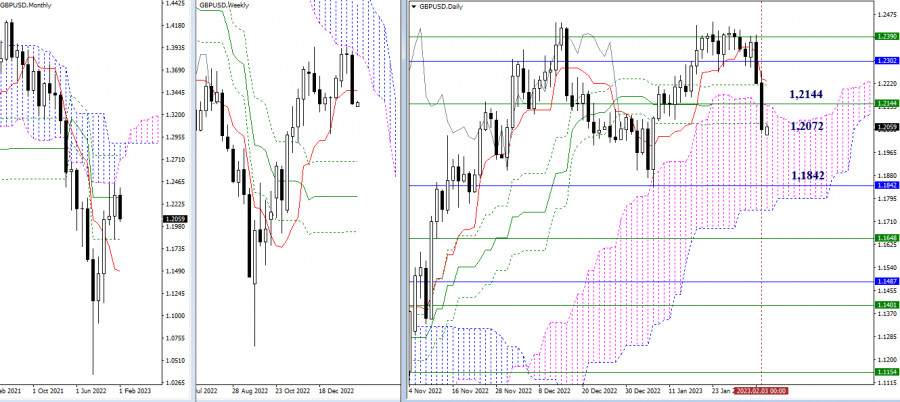
After trading for some time along the resistance level and the lower boundary of the weekly Ichimoku Cloud at 1.2390, the pair came under the control of the sellers. As a result, it closed last week below the key support levels of 1.2144 (weekly short-term trend) and 1.2072 (lower level of the daily Golden Cross). So, bears have entered the daily cloud and are confidently holding there. The levels left behind will now serve as new resistance that will protect the bearish trend. The next downward target is currently seen at the lower boundary of the daily Ichimoku Cloud and the monthly level of 1.1842.

This image is no longer relevant

H4 – H1

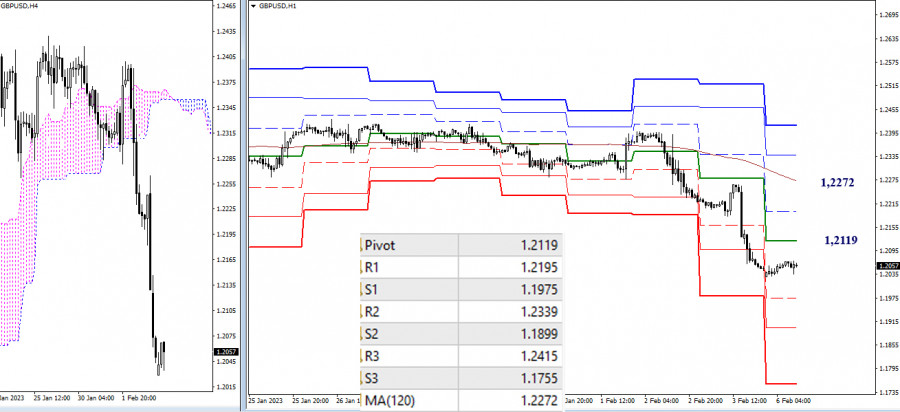
On lower time frames, bears are in control of the market. In the last few hours, the pair has been going through a correction. To deepen its current decline, the pair will need to pass the intraday support formed by the standard pivot levels of 1.1975 – 1.1899 – 1.1755. The key levels of the day are located at 1.2119 (daily central pivot level) and 1.2272 (weekly long-term trend). Consolidation above this range will change the market balance.

***

Technical analysis is based on:

Higher time frames – Ichimoku Kinko Hyo (9.26.52) + Fibo Kijun levels

Lower time frames – H1: Pivot Points (standard) + 120-day Moving Average (weekly long-term trend)

Evangelos Poulakis,
الخبير التحليلي لدى شركة إنستافوركس
© 2007-2025
Summary
Urgency
Analytic
Zhizhko Nadezhda
Start trade
كسب عائد من تغيرات أسعار العملات المشفرة مع إنستافوركس.
قم بتحميل منصة التداول ميتاتريدر 4 وافتح أول صفقة.
  • Grand Choice
    Contest by
    InstaForex
    InstaForex always strives to help you
    fulfill your biggest dreams.
    انضم إلى المسابقة

المقالات الموصى بها

التوقعات لليورو/الدولار الأمريكي في 11 يوليو 2025

يوم الخميس، واصل زوج اليورو/الدولار الأمريكي تراجعه نحو مستوى 1.1645، بينما تجاهل المتداولون إلى حد كبير مستوى التصحيح 127.2% فيبوناتشي عند 1.1712. قد يؤدي الارتداد من 1.1645 إلى تعزيز اليورو

Samir Klishi 12:44 2025-07-11 UTC+2

التوقعات لزوج الجنيه الإسترليني/الدولار الأمريكي في 11 يوليو 2025

على الرسم البياني الساعي، ارتد زوج الجنيه الإسترليني/الدولار الأمريكي يوم الخميس من منطقة المقاومة 1.3611–1.3633 واستأنف انخفاضه نحو مستوى فيبوناتشي 127.2% عند 1.3527. الارتداد من هذا المستوى سيعزز الجنيه الإسترليني

Samir Klishi 12:20 2025-07-11 UTC+2

على الرغم من احتمالية حدوث تصحيح، لا يزال الذهب يمتلك القدرة على التعزيز اليوم، الجمعة، 11 يوليو 2025.

XAU/USD، الجمعة، 11 يوليو 2025. على الرغم من أنه يبدو أنه قد تم تصحيحه بسبب توقفه عند المقاومة 1، إلا أن القوة المستمرة للظروف الفنية والأساسية لـ XAU/USD توفر فرصة

Arief Makmur 08:00 2025-07-11 UTC+2

توقعات EUR/USD ليوم 11 يوليو 2025

على الرسم البياني الأسبوعي لزوج اليورو/الدولار الأمريكي، نلاحظ مجموعة من إشارات الانعكاس: تباعد، تحول في الاتجاه في منطقة زمنية فيبوناتشي، وارتداد السعر من تقاطع خطين قويين — حدود قناة السعر

Laurie Bailey 06:58 2025-07-11 UTC+2

توقعات GBP/USD ليوم 11 يوليو 2025

على الرسم البياني الشهري لزوج الجنيه الإسترليني/الدولار الأمريكي، انعكس الجنيه الإسترليني من مستوى رد الفعل 161.8% لفايبوناتشي، المحسوب من الحد العلوي للقناة السعرية العالمية التي تمتد لـ 18 عامًا، مباشرة

Laurie Bailey 06:46 2025-07-11 UTC+2

توقعات USD/CAD ليوم 11 يوليو 2025

USD/CAD كان الدولار الكندي في حالة تماسك لمدة ثلاثة أيام قبل الاختراق الصعودي اليوم خلال جلسة المحيط الهادئ. لقد اخترق السعر بالفعل خط التوازن بظله العلوي. بعد توقف قصير

Laurie Bailey 06:42 2025-07-11 UTC+2

التوقعات لليورو/الدولار الأمريكي في 10 يوليو 2025

في يوم الأربعاء، واصل زوج اليورو/الدولار الأمريكي التحرك على مسار لا يعرفه إلا هو. تم تجاهل مستوى تصحيح فيبوناتشي 127.2% عند 1.1712 مرة أخرى من قبل المتداولين. لا أوصي باستخدامه

Samir Klishi 12:21 2025-07-10 UTC+2

التوقعات لزوج الجنيه الإسترليني/الدولار الأمريكي في 10 يوليو 2025

على الرسم البياني لكل ساعة، واصل زوج الجنيه الإسترليني/الدولار الأمريكي حركته الصعودية يوم الأربعاء بعد الارتداد من مستوى التصحيح 127.2% فيبوناتشي عند 1.3527. كان الارتداد دقيقًا، مما أدى إلى انعكاس

Samir Klishi 10:35 2025-07-10 UTC+2

تحليل وتوقعات والوضع الحالي للسوق لزوج الجنيه الإسترليني/الين الياباني

يوم الخميس، يستعيد زوج الجنيه الإسترليني/الين الياباني الزخم الصعودي ويظهر استعدادًا لمزيد من النمو. يؤكد تشكيل قناة صاعدة على استقرار الاتجاه الصعودي. خلال الجلسة الآسيوية، أصبح المشترون أكثر نشاطًا بالقرب

Irina Yanina 10:22 2025-07-10 UTC+2

إذا تمكن مستوى المقاومة عند 0.7964 من كبح حركته الصعودية، فإن لزوج USD/CHF إمكانية للضعف يوم الخميس، 10 يوليو 2025.

USD/CHF، الخميس، 10 يوليو 2025 بالإضافة إلى الشائعات حول تخفيض محتمل في سعر الفائدة من قبل الفيدرالي وانخفاض عوائد السندات الحكومية الأمريكية، ضعف زوج USD/CHF اليوم. المستويات الرئيسية 1. المقاومة

Arief Makmur 06:47 2025-07-10 UTC+2
لا تستطيع التحدث الآن؟
اطرح سؤالك في الدردشة.
Widget callback
 

Dear visitor,

Your IP address shows that you are currently located in the USA. If you are a resident of the United States, you are prohibited from using the services of InstaFintech Group including online trading, online transfers, deposit/withdrawal of funds, etc.

If you think you are seeing this message by mistake and your location is not the US, kindly proceed to the website. Otherwise, you must leave the website in order to comply with government restrictions.

Why does your IP address show your location as the USA?

  • - you are using a VPN provided by a hosting company based in the United States;
  • - your IP does not have proper WHOIS records;
  • - an error occurred in the WHOIS geolocation database.

Please confirm whether you are a US resident or not by clicking the relevant button below. If you choose the wrong option, being a US resident, you will not be able to open an account with InstaForex anyway.

We are sorry for any inconvenience caused by this message.