empty
14.04.2023 12:52 AM
Technical analysis of GBP/USD for April 13, 2023

This image is no longer relevant

Overview :

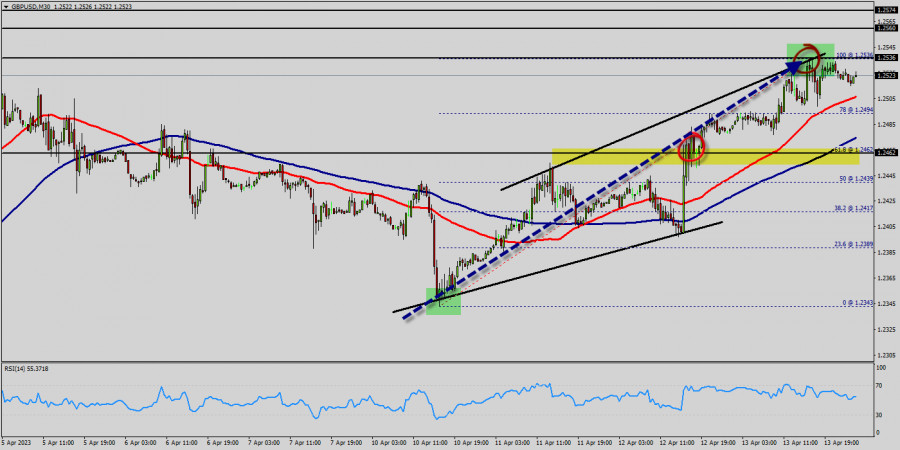
The GBPUSD pair traded with strong positivity yesterday to return to the bullish channel that appears on the chart, to head towards achieving expected additional gains in the upcoming sessions, targeting visiting 1.2522 level mainly. Therefore, we expect to witness more bullish bias in the upcoming sessions, noting that breaking 1.2462 and holding above it will stop the positive scenario and push the price to decline again.

The expected trading range for today is between 1.2462 support and 1.2560 resistance. The GBP/USD pair is going to continue to rise from the level of 1.2462 in the long term.

It should be noted that the support is established at the level of 1.2462 which represents the 61.8% Fibonacci retracement level on the M30 chart. The price is likely to form a double bottom in the same time frame. Accordingly, the GBP/USD pair is showing signs of strength following a breakout of the highest level of 1.2462.

So, buy above the level of 1.2462 with the first target at 1.2536 in order to test the daily resistance 1; and further to 1.2560.

Also, it might be noted that the level of 1.2560 is a good place to take profit because it will form a double top. The price is in a bullish channel now. In the Forex market, liquidity pertains to a currency pair's ability to be bought and sold at the current market price. Additionally, liquidity refers to market volatility and dynamics. Because the Forex market is colossal, it is also extremely liquid. Moreover, if a currency pair has high level of liquidity, it will be easier to trade.

On the other hand, in case a reversal takes place and the GBP/USD pair breaks through the support level of 1.2462, a further decline to 1.2343 can occur which would indicate a bearish market.

Trading recommendations :

The trend is still bullish as long as the price of 1.2463 is not broken. Thereupon, it would be wise to buy above the price of at 1.2463 with the primary target at 1.2536. Then, the GBP/USD pair will continue towards the second target at 1.2560.

In technical analysis: history usually repeats itself at certain level. So it will be of the wisdom to use historic rates to determine future prices. The technical analysis based only on the technical market data (quotes) with the help of various technical indicators. Moreover, in this book we will be touching on a variety of new techniques for applying numerical strategies, equations, formulas and probabilities. Additionally, we will be shared some of classical analysis such as breakout strategy and trend indicators. Alternative scenario : The breakdown of 1.2463 will allow the pair to go further down to the prices of 1.2403 and 1.2343.

Mourad El Keddani,
الخبير التحليلي لدى شركة إنستافوركس
© 2007-2025
حدد الإطار الزمني
5
د
15
د
30
د
1
س
4
ساعات
1
يوم
1
أسبوع
كسب عائد من تغيرات أسعار العملات المشفرة مع إنستافوركس.
قم بتحميل منصة التداول ميتاتريدر 4 وافتح أول صفقة.
  • Grand Choice
    Contest by
    InstaForex
    InstaForex always strives to help you
    fulfill your biggest dreams.
    انضم إلى المسابقة

المقالات الموصى بها

XAU/USD. التحليل والتوقعات. الوضع الحالي للسوق

من الناحية الفنية، يظهر الرسم البياني للذهب على مدى 4 ساعات قبولًا دون المتوسط المتحرك البسيط لفترة 100، مما يشير إلى احتمال استمرار الانخفاض. علاوة على ذلك، فإن المذبذبات

Irina Yanina 18:27 2025-06-24 UTC+2

إشارات التداول للذهب (XAU/USD) للفترة من 24 إلى 28 يونيو 2025: البيع تحت مستوى $3,327 (21 SMA - 200 EMA)

في بداية الجلسة الأمريكية، يتداول الذهب حول 3,300، تحت المتوسط المتحرك البسيط لـ 21 يوماً، وتحت المتوسط المتحرك الأسي لـ 200 يوم. لقد شهدنا تصحيحاً تقنياً قوياً تحت 3,390

Dimitrios Zappas 18:05 2025-06-24 UTC+2

إشارات التداول لليورو/الدولار الأمريكي للفترة من 24 إلى 28 يونيو 2025: بيع تحت 1.1620 (قمة ثلاثية - 8/8 Murray)

يظهر الرسم البياني H4 نمط تكوين ثلاثي القمم. إذا انخفض سعر اليورو إلى ما دون 1.1620، ستكون الإشارة سلبية، ويمكننا البيع بهدف عند 1.1533. قد يصل زوج اليورو/الدولار الأمريكي

Dimitrios Zappas 18:04 2025-06-24 UTC+2

توقعات الفوركس 24/06/2025: اليورو/الدولار الأمريكي، الدولار الأمريكي/الين الياباني، مؤشر الدولار الأمريكي، الجنيه الإسترليني/الدولار الأمريكي، النفط والبيتكوين

روابط مفيدة: مقالاتي الأخرى متوفرة في هذا القسم دورة InstaForex للمبتدئين التحليلات الشائعة افتح حساب تداول مهم: يجب على المبتدئين في تداول الفوركس أن يكونوا حذرين للغاية عند اتخاذ قرارات

Sebastian Seliga 12:35 2025-06-24 UTC+2

التوقعات لليورو/الدولار الأمريكي في 24 يونيو 2025

يوم الاثنين، قام زوج اليورو/الدولار الأمريكي على الرسم البياني الساعي بارتدادين من مستوى تصحيح فيبوناتشي 76.4% عند 1.1454، وانعكس لصالح اليورو وارتفع إلى مستوى فيبوناتشي 100.0% عند 1.1574، مستقرًا فوقه

Samir Klishi 10:48 2025-06-24 UTC+2

التوقعات لزوج الجنيه الإسترليني/الدولار الأمريكي في 24 يونيو 2025

على الرسم البياني الساعي، ارتد زوج الجنيه الإسترليني/الدولار الأمريكي يوم الاثنين من منطقة الدعم 1.3357–1.3373، وانعكس لصالح الجنيه الإسترليني، واستقر فوق منطقة 1.3425–1.3444 ومستوى تصحيح فيبوناتشي 127.2% عند 1.3527. ونتيجة

Samir Klishi 10:44 2025-06-24 UTC+2

هل يمكن لتصحيح ضعف الذهب أن ينجح في إيصاله إلى مستوى 3320، يوم الثلاثاء، 24 يونيو 2025.

1. ملخص معنويات السوق: بعد أن ارتفع الذهب بشكل ملحوظ أمس، شهد الذهب هذا الصباح تصحيحًا هبوطيًا بنسبة تصل إلى -0.39% حيث كان التصحيح نتيجة للظروف الجيوسياسية الحالية وديناميكيات

Arief Makmur 10:43 2025-06-24 UTC+2

توقعات EUR/USD ليوم 24 يونيو 2025

يوم الاثنين، نجح اليورو في اختراق المقاومة الخطية عند 1.1535 وخط MACD. ومنذ افتتاح جلسة المحيط الهادئ، واصلت الأسعار الارتفاع بثبات نحو مستوى الهدف 1.1692. قد يؤدي الاختراق

Laurie Bailey 04:51 2025-06-24 UTC+2

توقعات GBP/USD ليوم 24 يونيو 2025

GBP/USDتمكن الثيران في الجنيه الإسترليني بقوة من التغلب على ضغط الدببة، الذين كانوا يتوقعون الوصول إلى الهدف 1.3208. ومع ذلك، في هذه المرحلة، فإن مقاومة خط MACD عند 1.3570

Laurie Bailey 04:47 2025-06-24 UTC+2

توقعات USD/JPY ليوم 24 يونيو 2025

USD/JPY قد تحدد الصورة الفنية يوم الاثنين التطورات المستقبلية على المدى المتوسط. بدأ الأسبوع بفجوة صعودية، تلتها تشكيل ظل علوي طويل. حدث الإغلاق اليومي بالضبط عند مستوى الدعم 146.11،

Laurie Bailey 04:44 2025-06-24 UTC+2
لا تستطيع التحدث الآن؟
اطرح سؤالك في الدردشة.
Widget callback
 

Dear visitor,

Your IP address shows that you are currently located in the USA. If you are a resident of the United States, you are prohibited from using the services of InstaFintech Group including online trading, online transfers, deposit/withdrawal of funds, etc.

If you think you are seeing this message by mistake and your location is not the US, kindly proceed to the website. Otherwise, you must leave the website in order to comply with government restrictions.

Why does your IP address show your location as the USA?

  • - you are using a VPN provided by a hosting company based in the United States;
  • - your IP does not have proper WHOIS records;
  • - an error occurred in the WHOIS geolocation database.

Please confirm whether you are a US resident or not by clicking the relevant button below. If you choose the wrong option, being a US resident, you will not be able to open an account with InstaForex anyway.

We are sorry for any inconvenience caused by this message.